
I'm Jeffrey Jorgensen, a design leader living in Colorado.
systemssystems
I build the systems teams design inside of — then I sweat how they move.
I've spent my career where the data is complicated and the interface can't be — Deel, Dagster, Mixpanel, Proxy, Assemble. Tokens, components, prototypes, and the unglamorous handoff work that makes a team fast. Nebraska raised, Colorado based.
Selected work
Let's build
something
Hiring for a design leader, or want a second opinion on a system that's fighting your team? Either one is a good email.
Insights
Mixpanel was heading for the enterprise.
We needed an extremely flexible and powerful data-analysis and reporting tool, completely reimagined and designed from the ground up.
Mixpanel's flagship report was growing increasingly incapable of supporting the company's growth and goals.
As we moved up market into the enterprise, our users wanted the ability to see data from multiple sources (not just Mixpanel) in one centralized location.
Where we started…
 Segmentation — the flagship report of Mixpanel (in a different chrome).
What do our customers want?
I wanted a baseline of wants and issues with Segmentation as it was, so I analyzed a ton of customer support and sales data.
I gathered 5 years worth of user data from ZenDesk and Asana, put it into a spreadsheet and synthesized it to find related data.
 5 years worth of user data from ZenDesk and Asana, put into a spreadsheet.
Next, I used Mixpanel's event analytics to find Segmentation power users. A power user was defined as follows:
- Used Segmentation at least once a day
- Was a Segmentation user for >= 1 year
- Had written into customer support at least once in that time frame
The first point of contact with them was a survey to gather some general intel on their usage of Segmentation and determine if they'd be interested in working with me to design the product. After that, I interviewed customers to understand more about their survey answers and the issues they experienced with Segmentation.
Iterate, iterate, iterate…
For nearly every element of Insights, I had our users extensively test wireframes or prototypes. I used a validation study and interview guide rooted in IDEO's Design Kit.
 Wireframe and prototype iterations put in front of users.
Participants took part in a 60 minute session where they used the product and answered questions about their experience.
I'd use a Trello board to collate the interview responses to find common themes.
 I interviewed 5 users on nearly every element of Insights (this synthesis board was for the report legend).
Applying visual design.
Once we validated our designs with at least 80% of our users, we would begin to work on the visual treatment of the components and elements. The following is the final design of the Query Builder and Property Menu.
 The final design of the Query Builder and Property Menu.
Give developers what they want.
Our EPD team hadn't yet developed the Mixpanel Design System. While our engineers were incredible, I wasn't going to leave anything up to chance. Plus, engineering loved when we'd think through edge cases.
I tirelessly thought through every scenario and permutation for the Insights menu and provided engineering with the following Sketch file so they could build the menu right, and only once.
 Developer handoff to showcase the multiple permutations and states of the Insights menu.
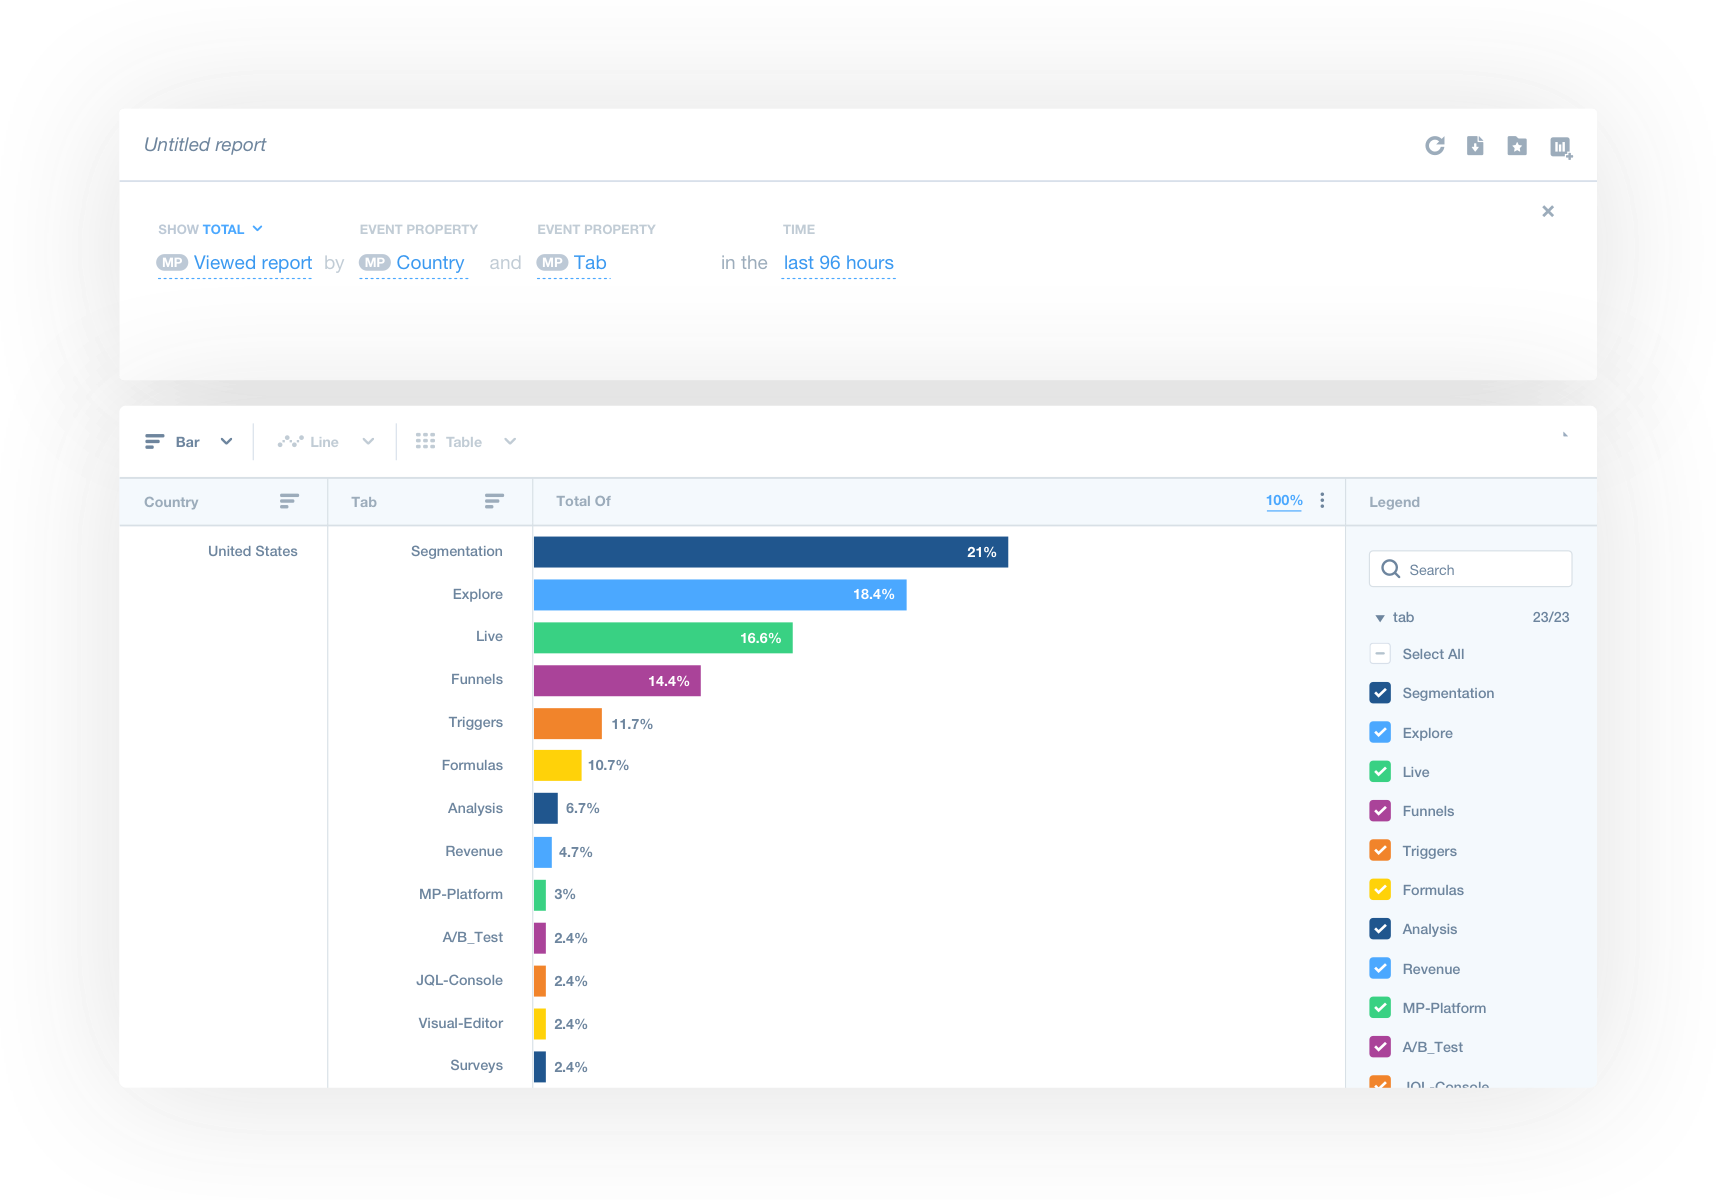
The final product.
Insights, as shipped.So how'd we do?
After shipping the product we closely monitored user-engagement and sought feedback from the interview group. The overall response was very positive, as were the results of the product:
Jeff is really good at putting the user first. He always tries to solve the problem with the customer in mind and actually seeks out direct customer feedback with research as much as possible. He tries to truly solve the customer problem rather than trying to make designs that just look good.
— Engineering Colleague, 2016Things I would do differently
Overall I was satisfied with the team's work, but I believe we could have done some things differently.
Shorten product iteration cycles — having to both design and PM the project lead to some inefficiencies in scheduling/managing.
Prototype earlier — a lot of the interactions were difficult to show in static form and could have benefitted from a small prototype.
Established MP's visual language first — Insights was being built in parallel to defining Mixpanel's new visual design language so there was a lot of unnecessary back-and-forth between UX and visual design.
Want to see what we can do?
Tell me what your team is stuck on. I'll tell you whether I'm the right help.
Contact me